Basketball Seeding: What is it?
Seeding is a relatively important concept in the world of basketball. March Madness enhances this importance tenfold. Using a simple tool like Google Trends demonstrates this quite nicely.
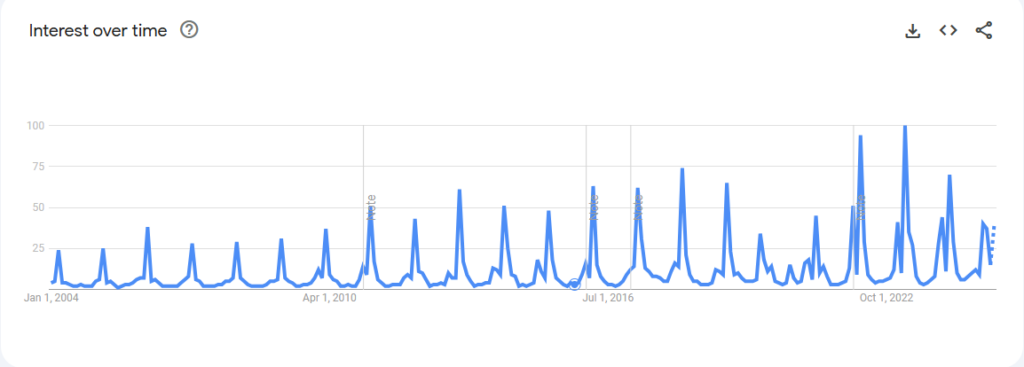
Every spike is the month of March.
Least to say, this is a popular concept during this time of the year.
According to the NCAA, every team is ranked using a voting system that loops on itself multiple times. Without going into the specifics, this voting system will give all 68 teams a ranking in the March Madness bracket. The actual region within the bracket is not fully determined by seeding and has many alternate rules, such as “Teams from the same conference cannot meet before the Elite Eight if they played each other three or more times.” The top four teams are given the seeding of 1, the next four the seeding of 2, and so on.
The Final Four and our Seeding Analysis:
This is an important notice before we begin—everything mentioned above concerns the rules and regulations of men’s bracketing. The rules and considerations differ for women’s bracketing and seeding; that information is also available here. The men’s stats for our analysis are pulled from 1979-2024 and are sourced here. The women’s stats for our analysis are pulled from 1994-2024 and are sourced here.
If you would like to check out our spreadsheet, which we used during this analysis, please reach out to us on Instagram or feel free to email us at thefastbreakstats@gmail.com.
The Framework:
We went through the busywork of compiling every time a seed made it to the Final Four. A seed was given an “occurrence” if it made it to the Final Four or made it to the championship, however, it wasn’t doubled counted if they got into both. Weight was also added to provide some value to a seed if they made it to the championship round.
Example: 1, 2, 3, and 4 seeds make it to the Final Four. 1 and 2 move on to the championship round. All four seeds are given a single ‘occurrence’. Then, imagine that the 3 and 4 seeds move on to the championship round and the 4 seed manages to win. In this scenario, the 1 and 2 are given one “weight point” for making it to the final four, the 3 seed is given two points because they lost the championship round against the 4 seed, who is given three points because they won the championship round.
We also kept track of each seed’s win-to-loss ratio in the final. It’s important to mention that if two of the same seeds made it to the final, they were given a win and a loss. But when it came to the collecting of the data, only the seeding of each team was taken into account during our analysis.
The Women’s Seeding:
We would like to start with the women’s seeding as, during our analysis, we found it more predictable and easier to understand.
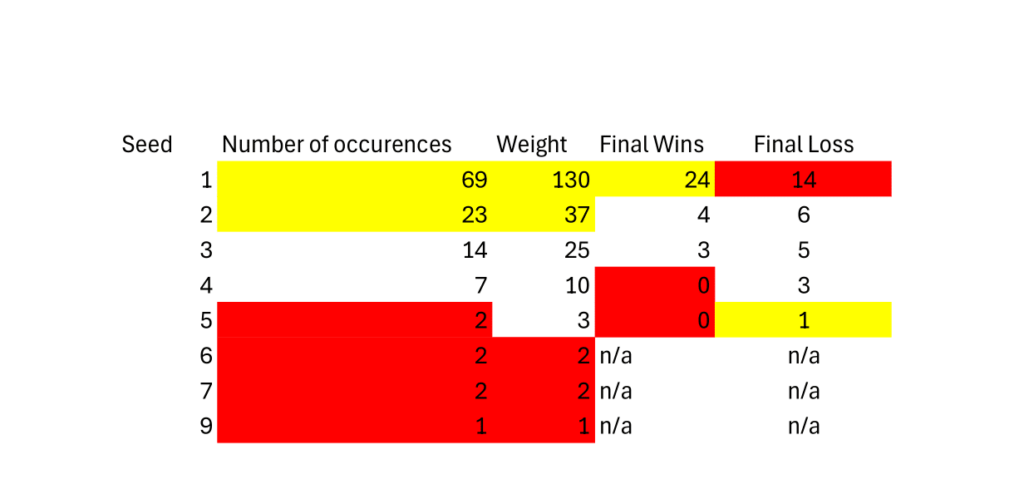
Yellow and red will always represent the worst seeds in a given stat category, roughly 1-3 seeds will be highlighted for each color. Yellow being the best, red being the worst. If a tie occurred, that is, on the edge of being included, all tied teams are highlighted. If a tie occurred that wasn’t on the edge, it wasn’t taken into account.
Ex. The 2’s below are on the edge because they are in second to last place. Ex. The 25% in the fifth table below aren’t on the edge, hence we ignore the tie and rank them as the two last place seeds in that category.
Points of Note:
An 8 seed never appears in the Final Four, as well as a 10-16 seed.
Anything under a 5 seed has never been to the championship game and no seed under 3 has won.
Looking at the table, we can see that the women’s 1 seed overwhelmingly leads in occurrences, weight, final wins, and losses. Losses are its one ‘bad stat’, but can pretty quickly be refuted based on the sheer number of occurrences, it should be expected to have the most losses.
Points of Note:
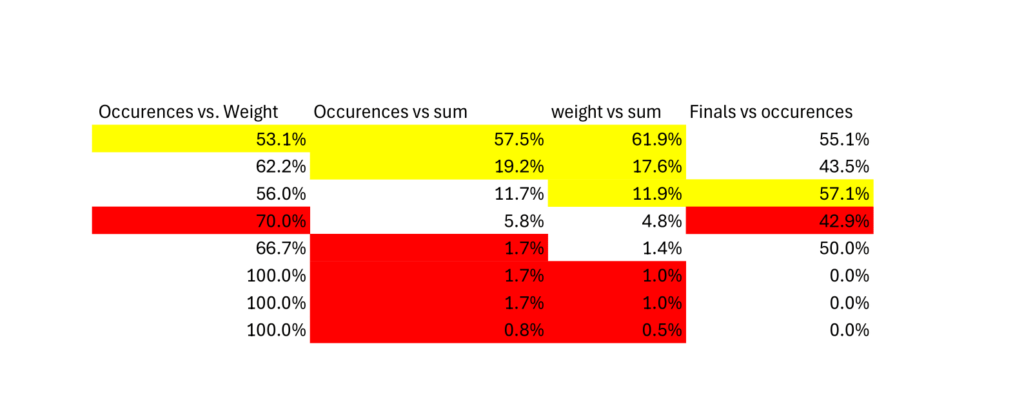
The 4 seed is the worst out of the “good seeds”.
The 1 seed is the best in every category or very close.
Occurrences vs Weight
Occurrences/Weight = %: This number is used to represent the distance each seed is from its weight, the smaller the better. The 1 seed, understandably, has the best percentage and, ignoring the three bottom seeds, the 4 seed has the worst percentage.
Occurrences vs Sum
Occurrences/Sum of Occurrences = %: This number is the amount of times a seed appears relative to the total possible number of occurrences, 120. We again see the 1 seed being the best, being in over 50% of the Final Four occurrences. The four bottom seeds, 5-7, and 9, all having a similarly low occurrence of less than 2%.
Weight vs Sum
Weight Points/Sum of Weight Points = %: This number is similar to the stat above, it represents the percentage of points each seed earned relative to the total number of points available, 210. We again see the 1 seed leading this category, even more so than the occurrences category due to the high participation in championship games. Which lines up with the bottom three seeds having zero championship participation.
Finals Seeding Data
Points of Note:
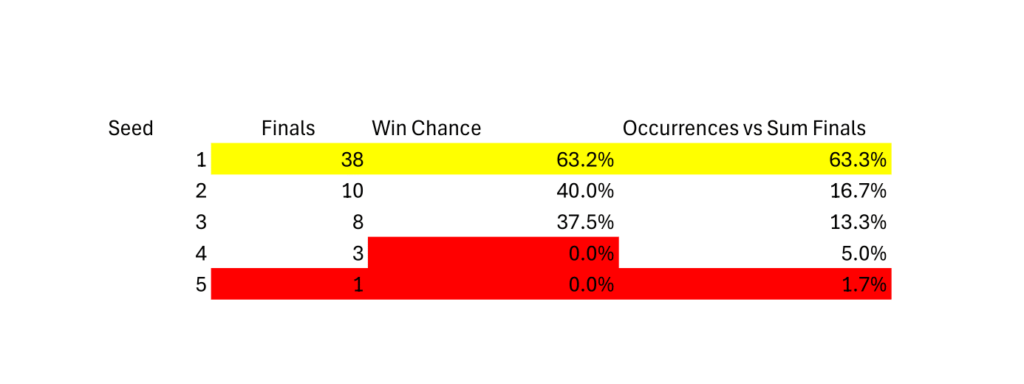
The 1 seed overwhelmingly wins this entire table.
Finals = Wins + Losses
Win Chance
Final Wins/Finals = %: Pretty self-explanatory. The percentage of finals each seed has won relative to their final occurrences. The 2 seed came closer than ever to the 1 seed in this category.
Occurrences vs Sum Finals
Finals/Sum of Finals = %: Much like the non-finals data, this is a measure of the percentage of final games each seed has played in relative to the amount playable, 60.
Finals vs Occurrences
Perhaps the single most important stat actionable stat out of the bunch.
Finals/Number of Occurrences = %: This number represents the percentage of games each seed has had in the championship game relative to the number of occurrences within the Final Four/championship round. We see the 3 and 4 seeds both leading and trailing the category respectively. This is incredibly important to mention because it’s the first time the 1 seed has lost anything important.
Actions to Take in Your Women’s March Madness Bracket:
Feel free to pick your way through the tables and make your own decisions. However, we can generally recommend that you always take 1, 2, and 3 seeds to the Final Four, while this may seem obvious, it may not be clear to some until the data is broken down.
However, if you have a really good feeling about a 3 seed vs 1 seed Final Four game, the data shows you should favor taking the 3 seed to the championship game over the 1 seed. If the 3 seed appears in the Final Four, they are just the slightest bit more likely to make it to the championship game. This isn’t foolproof, which can’t be stated enough.
While the women’s brackets and seeding are extremely predictable and line up with what’s expected the men’s brackets are a whole different story.
The Men’s Seeding:
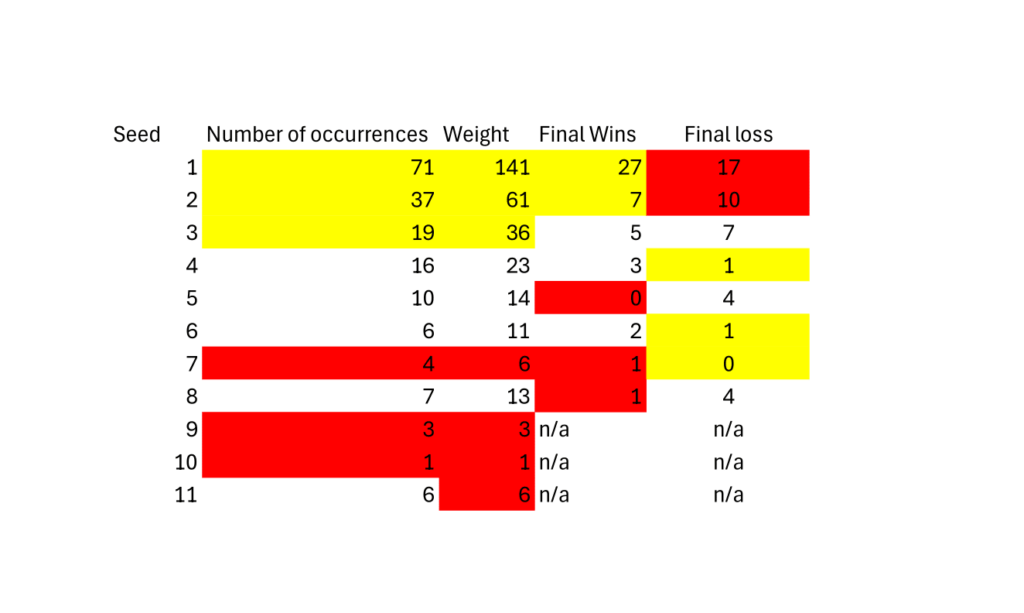
Points of Note:
Anything below an 8 seed never appears in the championship game.
Anything below an 11 seed never appears in the Final Four.
Much like the women’s data, the men’s 1 seed seems to be pretty overwhelming winning in all categories. However, a keen eye might notice that the 2 seed is much closer than in the women’s data.
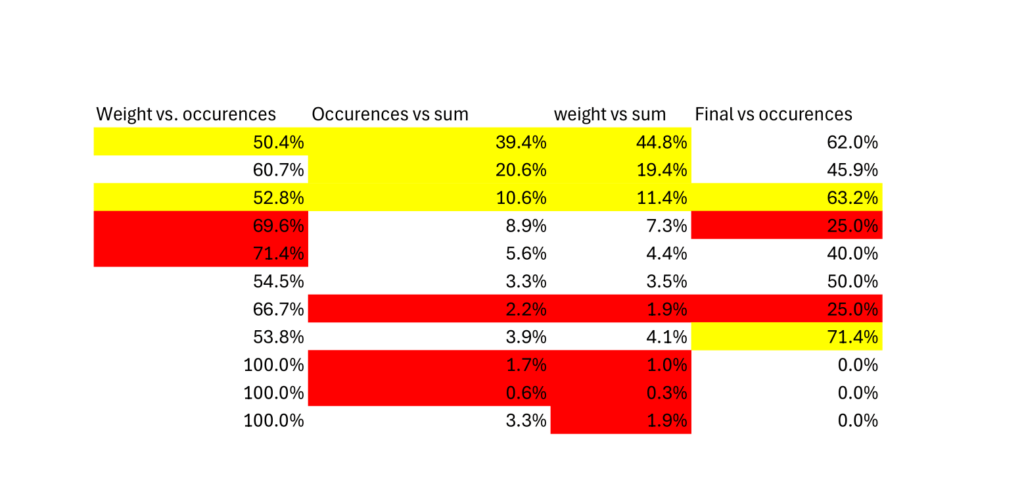
Points of Note:
The 3 seed ends up being the best out of the “good seeds”.
4 and 5 seeds end up not being very good.
(Every calculation from the women’s section can be applied here as well.)
Weight vs Occurrences
The 1 and 3 seeds leading this category, the 4 and 5 seeds trailing. The 6 and 8 seeds share a similarly low percentage with the 1 and 2 seeds.
Occurrences vs Sum
The 1, 2, and 3 seeds all understandably lead this category. The 11 seed isn’t the worst in this category. Sum is based on the number 180.
Weight vs Sum
We see a similar story in this stat as well. The 11 seed now ties for 3rd to last place with the 7 seed in this category due to its lack of final occurrences.
Finals Seeding Data
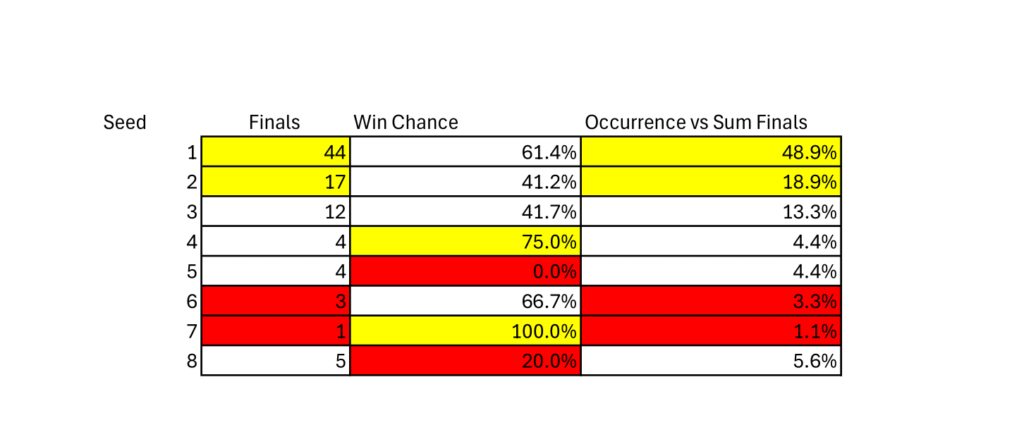
Points of Note:
No seed is the worst or best in all three categories.
The 1 seed generally has the best stats.
The 7 seed generally has the worst stats.
(Every calculation from the women’s section can be applied here as well.)
Win Chance
The 4 and 7 seed lead this category, however, we can most likely ignore the 7 seed at the very least due to its single win. This then gives us the 1 and 6 seeds as next best options for best win chance.
Occurrence vs Sum Finals
The 1 and 2 seeds lead this category. However, the 8 seed isn’t even either of the worst two seeds despite being the lowest seed.
Final vs Occurrences
Again, this stat is very important.
Unlike pretty much every other stat, we see the 3 and 8 seed leading this category with the 1 seed coming in an unhighlighted 3rd place. The 4 and 7 seeds being the losers in this category, with the 4 and 5 seeds tying for our 3rd to last place.
Actions to Take in Your Men’s March Madness Bracket:
Again, feel free to pick through the tables and come to your own conclusions. Generally, we would recommend taking 1, 2, and 3 seeds to your Final Four. Again, very predictable. However, some interesting insights you can take from this data is:
1. You should be taking 11 seeds to the Final Four more often than 7, 9, and 10 seeds.
2. You should also be taking 8 seeds to the championship game more than every other seed except 3. However, you probably shouldn’t be giving them the win. (They haven’t won since 1985.)
3. The 2 seed is one of the worst performing seeds, especially when referencing their 2nd to last place in occurrences and weight. You really shouldn’t take them to the finals, and they probably shouldn’t be your winner either.
Men’s vs Women’s Seeding:
We find in this data a quite a few things that are different between the women’s and men’s seedings.
1: The women’s seeding, generally, seems to be a more reliable and realistic metric when looking at the Final Four. Whether it’s the way teams are seeded, the relative youth of the program, and the many, many fewer years as an actual program, or it could be the 15 years less data the women have to work with.
2: Some basic Measurements of Center with relevance to seeding:
Non-Finals Mean, Median, Mode: Men: 2.99, 2, 1 | Women: 1.92, 1, 1
Finals Mean, Median, Mode: Men: 2.39, 2, 1 | Women: 1.65, 1, 1
3: The women have three years when the Final Four was made up of every 1 seed. 2018, 2015, and 2012. This happened only once in the men’s bracket in 2008.
4: The lowest seed to ever win was an 8 seed men’s team. The lowest seed to ever win in the women’s bracket was a 3 seed. The men have had seven wins below a 3 seed while the women have had none.
5: Despite having 15 years less data, the 1 seeded men’s teams have nearly the same number of occurrences as the 1 seeded women’s teams. 71 and 69 respectively. The men’s teams, however, seem to have better quality 1 seeds with a comparatively higher weight. They also have more wins and losses, and a better “final vs occurrences” percentage of 62% versus the women’s 55.1%.
-The FastBreakStats Blog

Leave a Reply